
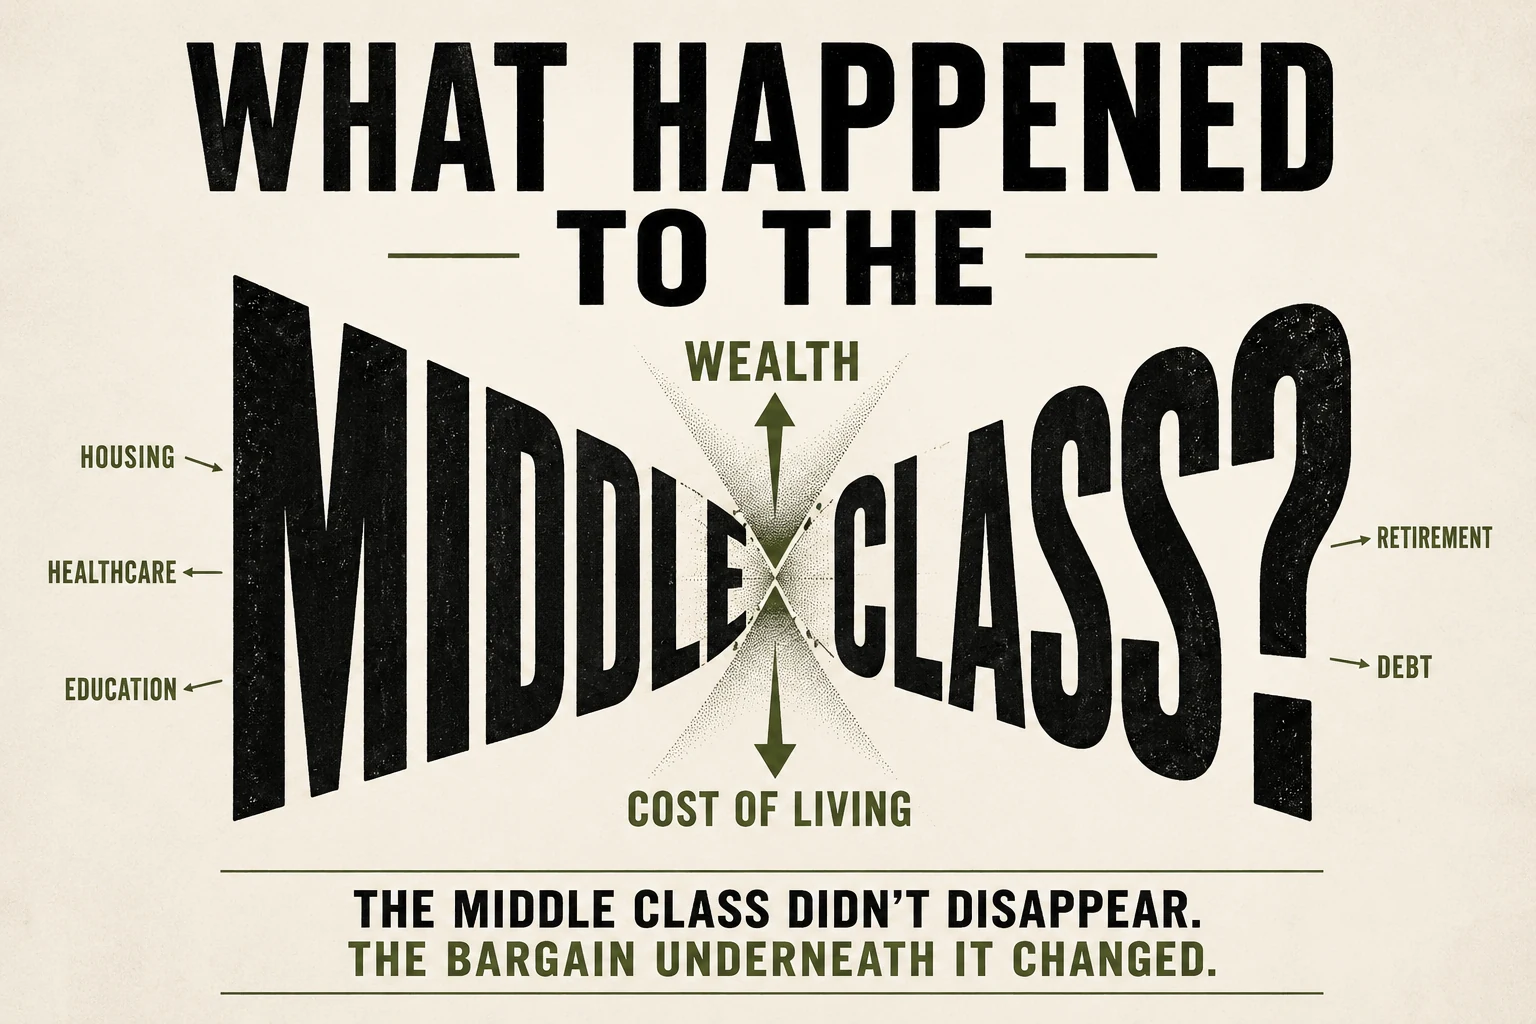
So you think the American middle class disappeared because we elected a president named Barack Obama? Maybe you think it started with the financial crash of 2008. Maybe you blame Biden. Trump. Bush. Reagan. Maybe you blame NAFTA, globalization or China.
Pick your villain.
But have you ever stopped long enough to ask a different question?
When did this actually start?
Because there was a period in American history when this country was doing something extraordinary.
America was building factories, highways, houses, schools, suburbs, cars, appliances, businesses and entire industries. Millions of working Americans were moving into a standard of living that earlier generations could barely have imagined. A factory worker could earn a paycheck that supported a household. A union job could come with health insurance, seniority protections and eventually a pension. Homeownership was expanding. The interstate highway system was connecting communities. Families who had rarely traveled far from home were loading children into automobiles, driving across state lines, staying in motels, eating in restaurants and spending money in communities all across America.
The middle class was becoming more than an income category. It was becoming an American expectation: work hard, buy a house, raise your children, take a vacation once in a while, put something away for retirement, maybe send your children to college, and believe that if you did your part, the country's economic system would give you a reasonable opportunity to build something better than what you started with.
That opportunity was never equally available. Black families faced redlining, housing discrimination, employment discrimination and unequal access to many of the same programs that helped white families accumulate wealth. Women faced economic and legal restrictions of their own. Poverty remained widespread in many communities. The America people remember from the 1950s was not paradise.
But the economic expansion itself was real.
Union membership was near its historical high. Manufacturing represented roughly a third of nonfarm employment at its early-1950s peak. Productivity and worker compensation moved upward together much more closely than they would later. Homeownership expanded dramatically. Black Americans were also beginning to build a larger working and professional middle class, even while fighting against institutions designed to restrict their participation.
So the question deserves an answer.
How did we get from there to here?
How did America go from building one of the largest middle classes in modern history to a country where a household can earn six figures and still wonder whether it can afford a home? When did the factory disappear? When did the pension disappear? When did union membership fall from roughly one worker in three to roughly one worker in ten? When did college become increasingly necessary for economic advancement while simultaneously becoming more expensive? When did healthcare become one of the largest pieces of worker compensation? When did housing become so dependent on geography that a salary that feels comfortable in Birmingham can feel entirely different in New York or San Francisco? And when did so much of the responsibility for surviving economic uncertainty move from institutions onto the household itself?
THE CENTRAL QUESTION Maybe the middle class was never destroyed in one dramatic moment. Maybe the economic bargain underneath it changed piece by piece.
Before We Can Ask What Happened, What Is the Middle Class?
Here is the first problem: there is no official federal definition of the American middle class.
Pew Research Center generally defines a middle-income household as one earning roughly two-thirds to twice the median, adjusted for household size. Using a recent methodology, a three-person household earning roughly $51,900 to $155,600 would fall into the broad middle-income range.
But even that doesn't completely answer the question.
A three-person household earning $100,000 in Birmingham and another earning $100,000 in San Francisco may both technically be middle income. Their lives are not economically equivalent. A single adult earning $75,000 and a five-person household earning the same amount are not economically equivalent either. And two families making identical salaries can be separated by hundreds of thousands of dollars in wealth.
One owns a house purchased twenty years ago. The other rents. One inherited money. The other inherited debt. One has a pension. The other has a 401(k) that depends on how much the household can afford to contribute. One has $100,000 in home equity and six months of emergency savings. The other has student loans, medical bills and $1,000 between itself and a financial emergency.
Same salary.
Different middle class.
That means this story has to separate two ideas. Middle income is where your paycheck places you in the income distribution. Middle-class security is what that paycheck actually allows you to withstand.
Can you afford your home? Can you survive a medical emergency? Can you repair your car without putting it on a credit card? Can you save for retirement? Can you help your children? Can you lose your job for three months without losing everything else?
That second definition may tell us more about what happened to the American middle class than income alone.
The America That Was Building
There is no directly comparable Pew-style middle-income percentage for 1950 and 1960, and Sunday Dinner Media is not going to invent one.
But the structural evidence tells us plenty.
Union density reached roughly 33.5% in 1954 and remained above 30% through much of the postwar period. Manufacturing reached approximately 32% of nonfarm employment in 1953. Productivity and real hourly compensation rose at nearly the same pace through the early postwar decades.
American manufacturing employment grew from roughly 14 million jobs in 1950 to about 15.4 million in 1960 and approximately 17.8 million in 1970. It would eventually peak around 19.6 million jobs in 1979.
That matters because manufacturing wasn't simply producing refrigerators, automobiles, televisions and steel.
It was producing middle-class pathways.
A person without a four-year college degree could enter a factory, learn a trade, become more productive, earn more money, sometimes join a union, obtain benefits, purchase a home and build a retirement. The job was part of a larger economic structure.
During this same period, Black Americans were gradually obtaining wider access to parts of that structure. That history should not be romanticized. Black homebuyers often faced discrimination. Black veterans did not receive equal access to every benefit associated with the GI Bill. Neighborhoods were segregated. Some unions discriminated.
But Black working families were still buying homes, entering government work, working industrial jobs, joining unions, opening businesses, earning degrees and building a larger professional class.
The uncomfortable historical timing is that broader Black access expanded in the 1960s and 1970s just as some of the institutions supporting the traditional middle class were beginning to weaken.
It was not civil rights that weakened those institutions.
But the timing matters.
Many Black Americans were finally gaining fuller access to the escalator.
Parts of the escalator were already beginning to slow.
1950s MIDDLE-CLASS REPORT CARD Direction: STRONG EXPANSION Industrial employment: Strong Union power: Near historical high Productivity and compensation: Moving closely together Homeownership: Expanding Middle-class institutional security: Strong, but highly unequal in access
The 1960s: The Expansion Continues, but Something Begins to Move
The 1960s were still years of tremendous economic expansion. Civil-rights laws began opening doors that had long been closed. Education expanded. Social insurance expanded. Poverty fell substantially. American industry remained powerful.
But underneath that strength, some early pressures were developing. Union density was beginning a long decline. Automation was changing production. Foreign competitors were becoming stronger. Industrial geography was shifting. Suburbs were growing while many central cities lost residents, businesses and tax bases.
None of this meant the middle class suddenly collapsed in 1965.
It means the system was beginning to change before most Americans recognized that it was changing.
1960s MIDDLE-CLASS REPORT CARD Direction: MODERATE EXPANSION / EARLY PRESSURE The middle-class structure remained strong, but some of its supporting institutions had begun weakening.
The 1970s: The Turning Point Nobody Talks About Enough
This may be the most important decade in the entire story.
If you begin the decline of the middle class with Barack Obama, you are decades late. If you begin it with NAFTA, you are still late. Even if you begin it with Ronald Reagan, you have missed part of the story.
The 1970s brought oil shocks, inflation, stagflation, slower productivity growth, increasing foreign competition, monetary instability, industrial restructuring and continued union decline.
And something especially important began happening between workers and the economy they helped produce.
From 1947 through 1973, productivity grew at roughly 2.8% per year while real hourly compensation grew around 2.6%. They did not move perfectly together, but they were close. From 1979 through 1990, productivity grew approximately 1.4% annually while real compensation grew around 0.5%.
Workers were still benefiting from productivity improvements.
But not as closely as before.
That distinction matters. The honest claim is not that workers stopped benefiting from productivity. They didn't. The better claim is that workers began capturing less of the gain than they had during the earlier postwar period.
And here is something else the numbers reveal: the middle-income population did not collapse during the 1970s. It represented approximately 59% of adults in 1970. It was still approximately 59% in 1980.
That may sound like nothing happened.
A lot happened.
The house was still standing.
Some of the beams underneath it had begun to weaken.
1970s MIDDLE-CLASS REPORT CARD Direction: EARLY EROSION Middle-income share: 59% → 59% Union power: Declining Productivity growth: Slowing Worker compensation: Beginning to lag productivity more noticeably Manufacturing: Nearing employment peak Inflation: Severe Industrial competition: Increasing The decline appeared in the structure before it fully appeared in the headcount.
The 1980s: The Changes Become Visible
By 1990, the middle-income share had fallen to roughly 56%.
That was a three-percentage-point decline from 1980—one of the largest decennial declines in the comparable series.
Ronald Reagan matters here.
But history becomes dishonest when we turn a president into an entire economic era.
Union decline had already begun. Industrial restructuring had already begun. Foreign competition had already increased. Productivity changes were already underway.
What changed during the Reagan period was the speed, policy direction and political philosophy surrounding some of those changes. Tax rates at the top fell substantially. The PATCO confrontation became an important moment in organized labor's history. Market-oriented policy gained influence. Corporate priorities increasingly emphasized shareholder returns. Deregulation expanded.
But Reagan did not wake up in 1981 and invent the forces reshaping the middle class.
He governed during—and influenced—a transformation already underway.
That distinction is the difference between history and campaign advertising.
1980s MIDDLE-CLASS REPORT CARD Direction: MODERATE EROSION Middle-income share: 59% → 56% Union power: Falling rapidly Income inequality: Increasing Corporate restructuring: Accelerating Industrial employment: Under increasing pressure
The 1990s: Everybody Remembers the Boom. Fewer Remember the Bargain Changing.
The 1990s complicate every simple political story.
The economy grew. Technology boomed. Unemployment became low. Household opportunity expanded in important ways.
But globalization also accelerated. NAFTA took effect. Global supply chains expanded. Financial integration deepened. Union membership continued its decline.
The middle-income population slipped from about 56% in 1990 to 55% in 2000. The population shift was not dramatic. The distribution of economic gains was becoming more important.
The middle tier's share of aggregate household income was declining while the upper tier was capturing a larger share.
And this is where another popular argument needs correction.
NAFTA did not single-handedly destroy the American middle class. It affected industries and communities. But manufacturing pressure existed before NAFTA, and American industry was also being transformed by automation, domestic relocation, productivity growth and global competition.
You cannot pull one thread out of this rope and pretend it was the rope.
The 2000s: The Factory Floor Gives Way
Then came the decade that delivered one of the hardest measurable blows.
Between roughly 2000 and 2010, America lost nearly six million manufacturing jobs—around one-third of the sector.
China's entry into the global trading system mattered. The so-called China Shock hit particular regions and industries especially hard. Factories closed. Supply chains moved.
And communities built around industrial employment lost more than jobs.
They lost diners, hardware stores, local banks, car dealerships, tax revenue, union halls and Little League sponsors.
The economic consequences spread outward from the factory gate.
But again, China wasn't working alone. Automation allowed factories to produce more with fewer workers. Offshoring changed who produced goods. Trade changed where some goods were produced. Technology changed how many people were required to produce them.
Those forces often hit the same worker at the same time.
And then came 2008.
The middle class did not begin dying in the financial crash.
The crash hit a middle class that had already been structurally changing for decades.
Jobs disappeared. Housing values collapsed. Foreclosures exploded. Retirement accounts fell. Household wealth was destroyed. Families that had spent decades accumulating home equity watched part of it disappear.
The 2008 crisis was not the beginning.
It was one of the greatest accelerants.
2000s MIDDLE-CLASS REPORT CARD Direction: SEVERE DISRUPTION Middle-income share: 55% → 52% Manufacturing: Nearly six million jobs lost Trade exposure: Severe in affected regions Financial system: Crisis Housing wealth: Major destruction Household security: Severely damaged
But Here Is the Part That Complicates the Entire Story
If the middle-income share fell, where did everybody go?
Not everyone went down.
Using a longer Pew historical series, the middle-income share fell from 61% in 1971 to 50% in 2021. During that same period, the upper-income share increased from 14% to 21%, while the lower-income share increased from 25% to 29%.
That means more of the shrinking middle corresponded with movement upward than downward.
That matters.
Because saying “the middle class shrank” can make it sound as though eleven percentage points of America fell into poverty.
They didn't.
Millions of Americans became more prosperous.
College-educated workers in particular gained substantially. The research shows inflation-adjusted median annual earnings for workers with bachelor's degrees or higher rising from around $69,400 in 1970 to about $80,000 in 2024, while earnings for high-school graduates moved from roughly $43,900 to about $40,100 in the same constant-dollar comparison.
The economy increasingly rewarded education and high-skill work. That created enormous opportunity.
It also changed what Americans needed to enter the middle class.
A high-school diploma that once opened the door to a strong industrial career became less powerful. College became more important.
And college became more expensive.
That's not one story.
It's two stories happening at once.
THE COMPLICATION The middle class became smaller partly because some Americans fell behind—and partly because others moved ahead.
The Black Middle Class: Same Paycheck, Different Cushion
Race makes the story even more complicated.
Black Americans have made extraordinary economic and educational progress. Black bachelor's-degree attainment increased from roughly 4% in 1970 to 27% in 2024. Black poverty fell from approximately 36% to 18% over that same broad period.
That progress is real.
So is the wealth gap.
Federal Reserve data for 2022 estimated median family wealth at roughly $536,000 for Asian families, $285,000 for White families, $61,600 for Hispanic families and $44,900 for Black families.
That isn't simply another income statistic.
It tells us something much deeper about economic security.
Income tells you what came into the house this year.
Wealth tells you how long the house can survive when income stops coming in.
A Black professional household and a White professional household can earn comparable salaries while having dramatically different home equity, inherited wealth, retirement assets, family financial support and liquid savings.
Current homeownership illustrates part of that divide. By late 2025, homeownership was approximately 75.1% for non-Hispanic White households, 63.1% for Asian/NHPI households, 48.7% for Hispanic households and 44.2% for Black households.
Because housing remains one of the primary ways ordinary American families accumulate wealth, that difference can compound across generations.
That means America does not have one middle class.
It has multiple middle-class experiences operating inside the same economy.
The Job Didn't Just Change. The Risk Changed.
This may be the most important finding in the research.
Think about retirement.
In the traditional pension model, you worked. The company invested. The company managed much of the risk. And if you met the conditions, the company owed you an income stream during retirement.
Today the dominant model increasingly tells the worker to contribute, invest, choose the funds, hope the market cooperates, estimate how long you're going to live—and don't run out of money.
In 2025, only about 24% of civilian workers had access to a defined-benefit pension, while roughly 65% had access to defined-contribution plans.
The 401(k) is not inherently bad. It is portable. It can create substantial wealth.
But the question of who carries the risk changed.
Healthcare tells a similar story.
The average employer-sponsored family health plan cost roughly $26,993 in 2025, with workers directly contributing about $6,850 toward premiums before deductibles, copayments and other expenses.
A worker can receive thousands of dollars more in total compensation and never feel richer because a growing portion of compensation may be consumed before it ever arrives in the paycheck.
Housing. Healthcare. Education. Retirement. Debt. Career transitions.
Across several areas of middle-class life, a larger share of financial risk moved toward the household.
THE RISK SHIFT America can become materially wealthier as a country while individual households feel less economically secure when more of the uncertainty is transferred directly onto them.
$100,000 Isn't $100,000 Everywhere
Now add geography.
The national price level is not the price level where you live.
Bureau of Economic Analysis regional price data show wide differences. California's overall price level stood well above the national average. Mississippi and Arkansas were far below it. Housing differences were even larger.
A three-person household earning $100,000 may technically qualify as middle income in San Francisco and Birmingham.
But nobody seriously believes those two households have identical purchasing power.
That means the sentence “A family making $100,000 is doing well” may be meaningless without another question:
Where?
And then there are taxes.
State income taxes matter. Property taxes matter. Sales taxes matter. Local taxes matter.
But the research found something important here too: no state income tax does not mean no tax.
Texas may have no individual state income tax while homeowners face significant property taxation. Florida may have no individual income tax while households still pay sales taxes, insurance, property costs and other expenses. New York households may pay higher taxes while receiving public services that reduce some expenses they might otherwise pay privately.
So it is too simplistic to say people leave high-tax states because taxes are destroying the middle class.
Taxes can matter.
Housing can matter more.
Insurance can matter.
Jobs matter.
Climate matters.
Retirement matters.
Family matters.
The meaningful question is not simply which state taxes less?
It is:
THE HOUSEHOLD QUESTION After taxes, housing, insurance, transportation, healthcare, childcare and wages are taken into account, how much economic capacity does the household actually have left?
That's the middle-class question.
So Who Did This?
This is usually where Americans want a name.
Give me the president. Give me the political party. Give me the corporation. Give me the union. Give me China. Give me NAFTA. Give me Wall Street.
Give me somebody I can point at.
The history refuses to cooperate.
Truman and Eisenhower governed during the consolidation of the postwar industrial economy. Kennedy and Johnson governed during continued expansion, civil-rights reform and the beginnings of some structural pressures. Nixon governed during monetary upheaval, inflation and intensifying economic change. Ford and Carter struggled with stagflation and energy shocks.
Reagan accelerated important tax, labor and regulatory changes, but inherited union decline, inflation, industrial pressure and global competition already underway. George H.W. Bush continued global economic integration. Clinton presided over strong growth and a technology boom while embracing NAFTA, deeper global trade and financial liberalization. George W. Bush governed through the China Shock, tax changes and a housing and credit boom that ended in financial collapse.
Obama inherited that collapse and oversaw a lengthy recovery without reversing many of the structural forces that predated him. Trump's first term brought tax changes, tariffs and a strong pre-pandemic labor market before COVID produced an extraordinary shock. Biden's years brought rapid labor-market recovery and renewed industrial policy alongside severe inflation and housing-affordability pressures.
The story isn't that nobody made choices.
They did.
The story is that many people made choices over many decades.
Government wrote rules. Corporations responded to them—and often lobbied to shape them. Consumers demanded cheaper products. Companies searched for cheaper production. Technology made factories more productive. Shareholders demanded returns. Workers lost bargaining power. Trade created winners. Trade created losers. Housing became an investment. Education became a credential. Healthcare became an increasingly expensive piece of compensation.
And households absorbed more of the risk.
THE VERDICT There is no single villain because there was no single decision.
Where We Are Now
The middle class still exists.
It is not collapsing into extinction.
The latest solid figures put approximately 52% of adults in the middle-income tier, 30% in the lower-income tier and 18% in the upper-income tier. That middle share has been relatively stable around the low-50s since roughly 2010.
But compare that with 1970:
59% middle income then.
52% now.
And the greater change may be economic power.
Middle-income households once received roughly 62% of aggregate household income. By 2022, their share was around 43%.
The country became richer.
The middle did not capture the same proportion of that growth.
That may be the statistic people have been feeling without knowing how to describe it.
Can We Rebuild It?
We cannot rebuild 1955.
And we shouldn't try.
1955 came with segregation, discrimination, limited opportunity for women, poverty, environmental damage and economic exclusions nobody should romanticize.
The goal is not to recreate the past.
The goal is to understand what worked economically and build something better without recreating what was wrong socially.
That means asking hard questions. Can workers capture a greater share of productivity gains? Can collective bargaining, employee ownership, profit sharing or other models strengthen worker power? Can America create manufacturing and technical careers that do not require everybody to obtain a four-year degree? Can apprenticeships and community colleges become genuine pathways rather than consolation prizes?
Can we build enough housing in high-opportunity areas to reduce the punishment families face simply for living near good jobs? Can healthcare costs stop consuming so much compensation? Can retirement systems combine the portability of modern accounts with more protection against longevity and market risk? Can industrial policy rebuild domestic capacity without simply becoming corporate welfare? Can trade policy protect strategic industries without imposing unnecessary costs on consumers? Can small businesses obtain the capital required to become durable institutions?
And can we create an economy where becoming more productive means workers, communities and shareholders all participate in the reward?
None of those solutions are free.
Stronger unions can raise labor costs. Tariffs can protect one factory while raising costs for another. Housing construction can reduce prices while meeting fierce resistance from existing homeowners. Industrial subsidies can build strategic industries or waste billions of dollars. Healthcare savings for households mean somebody else in the healthcare system receives less revenue.
There is no magical policy that puts America back in 1960.
But understanding the bargain we once had—and how it changed—gives us a better chance of deciding what kind of bargain should replace it.
Maybe We Have Been Asking the Wrong Question
So maybe the question was never:
Who destroyed the middle class?
Maybe that question is too easy.
Maybe that's why politicians love it.
It gives you somebody to hate.
Obama. Reagan. Trump. Biden. Clinton. Bush. China. NAFTA. Wall Street. Unions. Corporations. Immigrants. Globalization.
Pick somebody.
The harder question is:
What happened to the bargain?
What happened to the relationship between work and security? Between productivity and compensation? Between companies and employees? Between income and housing? Between education and opportunity? Between retirement and risk? Between wealth and wages? Between communities and the industries that once sustained them?
Because the research tells us something uncomfortable.
America did not simply wake up one morning and lose its middle class.
We changed the structures underneath it.
Sometimes deliberately. Sometimes because of technology. Sometimes because of global competition. Sometimes because consumers wanted lower prices. Sometimes because companies wanted higher profits. Sometimes because politicians changed the rules. Sometimes because an old system genuinely needed to change.
And sometimes because nobody stopped long enough to ask what would happen to the people standing underneath it.
The middle class didn't disappear.
It changed.
The country changed around it.
And the people inside it were asked to carry more of the uncertainty themselves.
THE SUNDAY DINNER QUESTION If America was capable of building a middle class once, what are we willing to build now so working people can feel economically secure again?
Sources & References (96)
PRINCIPAL SOURCES & REFERENCES
Pew Research Center — The United States at 250: How the Country Has Changed in the Past 50 Years
Primary source for the article's comparable 1970–2024 income-tier series, including the share of adults classified as lower, middle and upper income. The series reports the middle-income share at 59% in 1970, 59% in 1980, 56% in 1990, 55% in 2000, 52% in 2010, 53% in 2019 and 52% in 2024. It also provides historical earnings, education, poverty and demographic measures.
Methodology: Pew analysis of the 1970, 1980, 1990 and 2000 decennial censuses and the 2010, 2019 and 2024 American Community Survey, using IPUMS data.
View source:
https://www.pewresearch.org/social-trends/2026/03/25/the-united-states-at-250-how-the-country-has-changed-in-the-past-50-years/
Pew Research Center — The State of the American Middle Class
Primary source for long-term middle-class income analysis, including the distribution of aggregate household income. Pew reports that middle-income households received 62% of aggregate U.S. household income in 1970 and 43% in 2022.
This report also explains that “middle class” and “middle income” can describe different concepts and provides demographic, educational, occupational and geographic analysis of the American middle class.
Methodology: Historical analysis primarily uses the Current Population Survey Annual Social and Economic Supplement; demographic analysis uses the American Community Survey.
View source:
https://www.pewresearch.org/2024/05/31/the-state-of-the-american-middle-class/
Pew Research Center — Middle-Class Methodology
Methodological source for Pew's definition of middle-income households as generally those with household income between two-thirds and twice the median after adjustment for household size. Also documents cost-of-living adjustments used for geographic comparisons.
View source:
https://www.pewresearch.org/2024/05/31/middle-class-methodology/
Pew Research Center — 2026 Income-Tier Methodology
Primary methodological support for the recent three-person-household middle-income range cited in the article.
Pew's 2026 methodology places middle-income adults in families with adjusted family incomes between two-thirds and twice the median adjusted family income. Using a median of approximately $77,800, Pew calculates a middle-income range of approximately $51,900 to $155,600, expressed in 2024 dollars and scaled to a household size of three.
This replaces the previously listed “Americans and AI” methodology URL, which was unrelated to the income claim.
View source:
https://www.pewresearch.org/social-trends/2026/06/16/working-parents-methodology/
Congressional Research Service — A Brief Examination of Union Membership Data
Primary historical source for long-run U.S. union membership and union-density trends, including the postwar high point and subsequent decline in organized labor's share of the workforce.
View source:
https://www.congress.gov/crs-product/R47596
U.S. Bureau of Labor Statistics — Union Members, 2025
Primary federal source for current union membership and representation rates, including demographic and industry comparisons.
View source:
https://www.bls.gov/news.release/union2.htm
U.S. Bureau of Labor Statistics — Forty Years of Falling Manufacturing Employment
Primary federal source for the historical manufacturing-employment series used in the article. BLS reports that manufacturing's share of total nonfarm employment peaked at approximately 32% in May 1953 and that manufacturing employment reached an all-time peak of approximately 19.6 million in June 1979.
The source also documents the subsequent long-term decline in manufacturing employment.
View source:
https://www.bls.gov/opub/btn/volume-9/forty-years-of-falling-manufacturing-employment.htm
U.S. Bureau of Labor Statistics — Understanding the Labor Productivity and Compensation Gap
Primary source for the article's discussion of the long-run relationship between labor productivity and worker compensation and the widening divergence that emerged after the earlier postwar period.
Because productivity and compensation comparisons depend on the sector, compensation measure, inflation adjustment and time period selected, figures in the article should be interpreted within the specific BLS methodology rather than as a universal measure of every American worker.
View source:
https://www.bls.gov/opub/btn/volume-6/understanding-the-labor-productivity-and-compensation-gap.htm
U.S. Census Bureau — Income in the United States: 2024
Primary federal source for official household-income statistics, including median household income and income-distribution measures.
View source:
https://www.census.gov/library/publications/2025/demo/p60-286.html
U.S. Census Bureau — Housing Vacancy Survey, Fourth Quarter 2025
Primary federal source for the homeownership figures used in the article.
For the fourth quarter of 2025, Census reported homeownership rates of approximately 75.1% for non-Hispanic White householders, 63.1% for Asian, Native Hawaiian and Pacific Islander householders, 48.7% for Hispanic householders of any race, and 44.2% for Black householders.
View source:
https://www.census.gov/housing/hvs/files/qtr425/Q425press.pdf
Federal Reserve Board — Survey of Consumer Finances: Greater Wealth, Greater Uncertainty
Primary Federal Reserve source for racial and ethnic differences in family wealth and the article's discussion of the distinction between annual income and accumulated household wealth.
The Survey of Consumer Finances is particularly important to the article's argument that households with similar incomes may possess substantially different levels of economic resilience because of differences in assets, housing equity, retirement holdings, debt and inherited resources.
View source:
https://www.federalreserve.gov/econres/notes/feds-notes/greater-wealth-greater-uncertainty-changes-in-racial-inequality-in-the-survey-of-consumer-finances-accessible-20231018.htm
Federal Reserve Bank of New York — Household Debt and Credit
Primary source for mortgage, automobile, student-loan and credit-card balances, along with household delinquency trends.
View source:
https://www.newyorkfed.org/newsevents/news/research/2026/20260210
KFF — Employer Health Benefits, 2025
Primary source for employer-sponsored health-insurance costs used in the article. KFF reports average annual family premiums approaching $27,000 in 2025, with workers contributing approximately $6,850 toward those premiums.
These premium figures do not represent all healthcare spending by a household; deductibles, copayments, coinsurance and other out-of-pocket expenses can occur in addition to premium contributions.
View source:
https://www.kff.org/health-costs/annual-family-premiums-for-employer-coverage-rise-6-in-2025-nearing-27000-with-workers-paying-6850-toward-premiums-out-of-their-paychecks/
U.S. Bureau of Economic Analysis — Regional Price Parities
Primary federal source for differences in purchasing power and price levels among states and metropolitan areas.
This source supports the article's argument that identical nominal household incomes can produce significantly different standards of living depending on geography, particularly because of housing and other regional price differences.
View source:
https://www.bea.gov/data/prices-inflation/regional-price-parities-state-and-metro-area
Internal Revenue Service — Statistics of Income Migration Data
Primary federal source for interstate migration based on tax returns, including movement of households and adjusted gross income between states.
IRS migration data document movement but do not, by themselves, establish why a household moved.
View source:
https://www.irs.gov/statistics/soi-tax-stats-migration-data
U.S. Census Bureau — Current Population Survey Migration Definitions
Federal methodological source concerning reported reasons for residential moves, including employment, housing, family and other considerations.
Used with IRS and other migration evidence to avoid attributing interstate movement solely to taxation.
View source:
https://www.census.gov/programs-surveys/cps/technical-documentation/subject-definitions.html
National Bureau of Economic Research — The China Shock: Learning from Labor Market Adjustment to Large Changes in Trade
Major economic research concerning the effects of increased Chinese import competition on U.S. local labor markets, employment, wages and adjustment.
The study supports treating trade exposure as one contributor to manufacturing and labor-market disruption rather than as the sole explanation for the long-term transformation of the American middle class.
View source:
https://www.nber.org/papers/w21906
National Bureau of Economic Research — Automation and New Tasks: How Technology Displaces and Reinstates Labor
Economic research examining how automation can displace some forms of labor while technological change can also create new tasks and employment opportunities.
This source supports the article's distinction between trade, automation and other overlapping causes of labor-market restructuring.
View source:
https://www.nber.org/papers/w25684
Federal Reserve Board — Research on the Shift Away From Defined-Benefit Pension Plans
Research concerning the long-term transition from traditional defined-benefit pensions toward defined-contribution retirement arrangements.
This evidence supports the article's broader discussion of the transfer of retirement investment and longevity risk toward individual households.
View source:
https://www.federalreserve.gov/econres/feds/are-firms-or-workers-behind-the-shift-away-from-db-pension-plan.htm
College Board — Trends in College Pricing and Student Aid 2025
Primary research source for long-term tuition, college pricing, financial aid and higher-education cost trends.
Used in the article's discussion of the increasing economic importance of



The conversation is open
Be the first reader to add a thoughtful response.